
Find Out Why the Trial Did What It Did

When outcomes are in, MiraTyper measures the tissue the trial already collected and correlates those measurements with response and toxicity — so the next design starts from evidence, not hypothesis.

  • Correlate measured tissue features with response, toxicity, and survival
  • Separate non-responders who lacked the target from those who blocked the therapy
  • Turn the findings into detectors that select patients in the next study
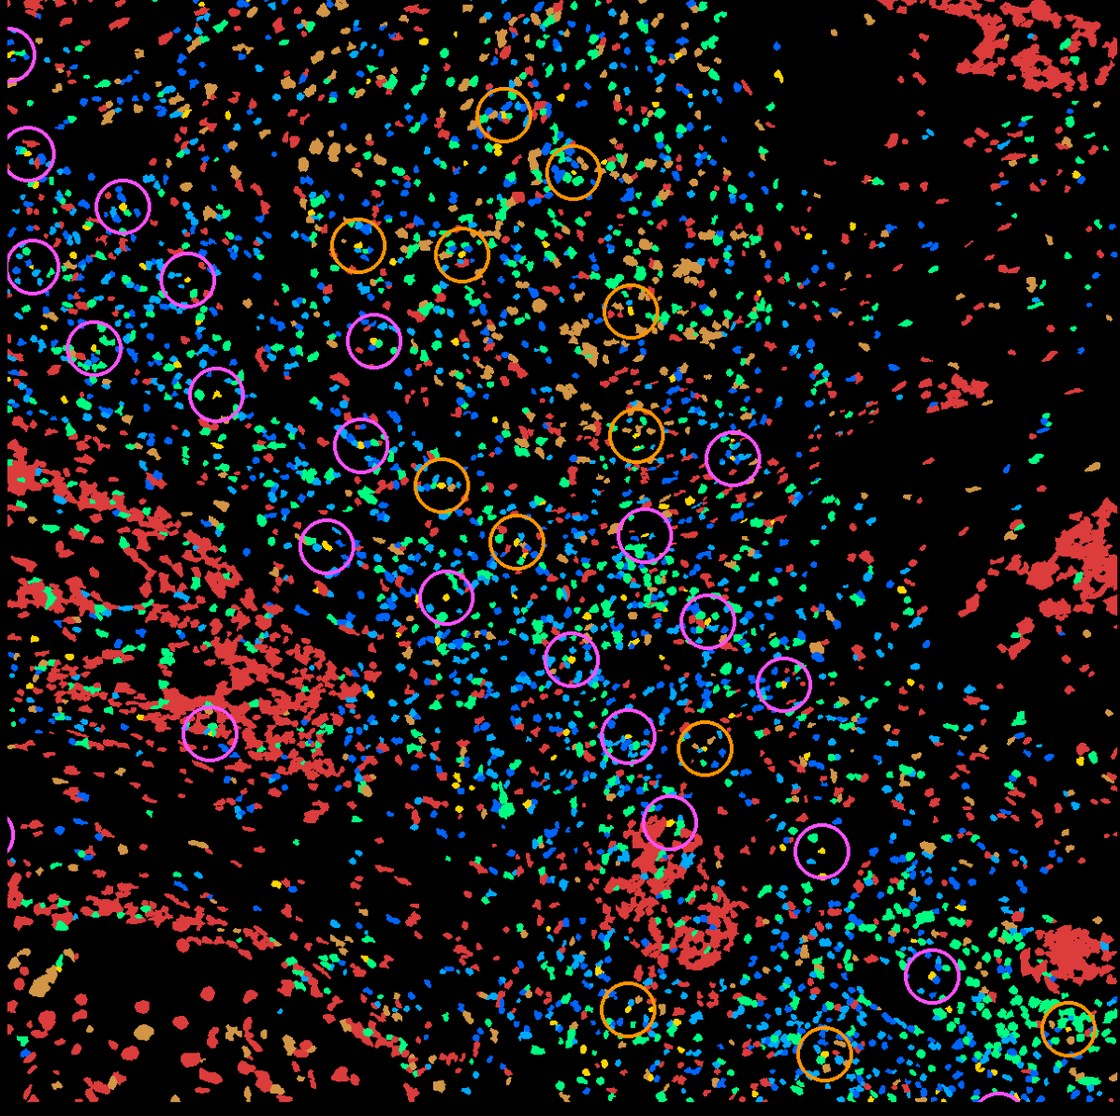
Spatial map of a tumor with cells colored by type and circles marking immune triads
Immune community structure, quantified per patient and testable against outcomes.

Three Steps, Agreed Up Front

1

Measure the trial tissue

Run the agreed feature detectors across the trial’s slides and any spatial or single-cell data, producing one feature table per patient.

2

Test against outcomes

Correlate features with response, toxicity, and survival. Report effect sizes and distributions, not just significance.

3

Build what you found

Features that hold up become validated detectors, ready to select or stratify patients in the next study.

Measurements, Not a Verdict

Every number traces back to the region of the slide it came from, so the pathology team can check the work.

Feature-outcome analysis

Measured features tested against the clinical endpoints the trial recorded.

Responder and non-responder profiles

What separated the groups, expressed as measurements a pathologist can see on the slide.

Candidate stratification rules

Draft criteria for the next protocol, with the evidence behind each one.

Reusable feature detectors

A primitive is a model that measures one defined feature, such as lymphocyte density or malignant-cell content. Detectors built for this analysis remain available for later studies, with validation for each new tissue or platform.

From Tissue Measurements to Testable Biology

These studies connect immune-cell states, spatial organization, and molecular phenotype to specific biological questions for follow-up.

Elephas · AACR 2026

Define immune phenotypes of drug response

Elephas profiled 46 cytokines in live tumor fragments from 193 patient samples treated with checkpoint inhibitors ex vivo. The response-associated cluster contained four immune phenotypes spanning tumor types.

These functional profiles provide a framework for investigating which cell states and tissue features accompany different immune responses.

An ex vivo study; links between the phenotypes and the depth and durability of clinical response remain under investigation.

Read AACR abstract 1389
Atera · Cervical cancer

Locate a candidate mechanism at the tumor border

In one cervical tumor section, low-maturation dendritic cells were closer to malignant cells than mature dendritic cells: a median 7.6 versus 17.1 µm. Lower CD40 expression persisted after adjustment for local density and other measured covariates.

The result focuses follow-up on a specific cell state and antigen-presentation pathway at the tumor interface.

A hypothesis from one tissue section; the analysis does not establish a causal mechanism or treatment effect.

Read the cervical analysis
TCGA · Colorectal cancer

Connect spatial patterns to molecular phenotype

Across 120 H&E slides, inferred neutrophil pockets were associated with microsatellite instability (MSI). Of eight candidate features, only this feature remained significant after correction for multiple testing (adjusted p = 0.0041).

The association identifies a spatial feature for targeted pathology and molecular follow-up across a cohort.

MSI was the endpoint, not treatment response. Bulk RNA did not positively confirm the inferred cell-abundance estimates.

Read the TCGA analysis

These studies identify measurable features and hypotheses for follow-up. For reverse translation, the next step is to test those features against recorded outcomes in an independent patient cohort.

See what MiraTyper finds in your data

Add your details, pick a time and we will run two datasets for free. Quick and easy.

  1. 1. Your details
  2. 2. Choose a time

Before You Book

Our trial already failed. Is this still worth doing?

That is usually the highest-value case. A failed trial with archived tissue and recorded outcomes contains the evidence for whether the drug missed its target, the population was wrong, or delivery failed — three very different next steps.

How is this different from a standard biomarker analysis?

The measurements are exhaustive and spatial rather than a handful of scored fields, and the same measurements can be reapplied to any other cohort, because they sit in a shared label space.

Can you work with our existing spatial data?

Yes. Supported platforms include Xenium, CosMx, Atera, Singular, Visium, and Visium HD, plus 10x single-cell. New instruments typically onboard in one to five days.

Who owns the resulting models?

That is agreed in the pilot scope before work starts, along with where the models run and who can run them.

Run two datasets for free

Bring one asset and one decision. We will tell you on the call whether the tissue can answer it.

P.S. The tissue from a finished trial is evidence that has already been paid for; the question is whether it gets measured.