
Cell typing and malignant calls for single-cell, spatial and H&E data
h5ad in, 425 cell types out.
Fast, simple, accurate, consistent across 10x Chromium, CosMx, Xenium, Visium HD, Singular & H&E. It’s really that easy.
Cell Annotation Is a Cornerstone of Biology
Understanding a tissue starts with knowing which cells are present. Bad annotations compromise your downstream analysis. Consistent annotation enables researchers to compare cell types and states confidently across datasets, instruments, and studies.
Slow and Subjective
Hand-labeling can consume weeks of scientist time, and annotations can vary between analysts.
Reference-Dependent
Label-transfer tools inherit the gaps and biases of the available reference, and need a tissue-specific model each time.
Batch-Sensitive
Accuracy drifts across platforms, donors, and runs, so results stop being comparable when conditions change.
Start with the Data You Already Have
Available models and validation depend on the assay and panel.
| Technology | Supported data and workflows |
|---|---|
| Xenium | Spatial RNA panels: 5K, 500, and Immuno-Oncology 380. |
| CosMx | Spatial RNA panels: 1K and 6K. |
| Atera | Whole-transcriptome spatial RNA (Xenium WTA). |
| Singular G4X | Spatial RNA and protein panels; lung-panel benchmarks available. |
| Visium | Spatial gene expression for cell typing. |
| Visium HD | Spatial gene expression with H&E-based cell segmentation. GPU required for image-based segmentation. |
| 10x Chromium | Single-cell RNA, 3′ and 5′, supplied as AnnData. |
| H&E | Whole-slide tissue measurements and image-based cell segmentation. GPU required. |
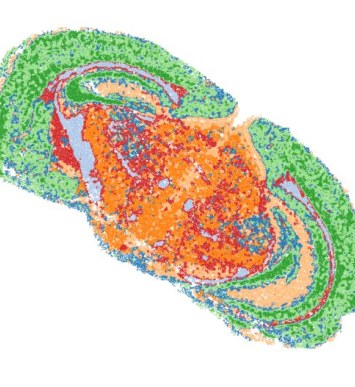
| Takara Seeker Prototype | Spatial RNA cell typing demonstrated in mouse brain tissue. |
One Tool, Deterministic by Design
MiraTyper returns the same labels on every run, across tissues, platforms, and species.
Deterministic
The same input yields the same cell types and states on every run. MiraTyper is not LLM-based, so there are no tokens and no run-to-run variance.
Laptop-Class Hardware
Transcriptomics inference runs on CPU: roughly 300–480 cells per second on a laptop in whole-slide runs. H&E models, including image-based segmentation for Visium HD, require a GPU.
No Model Selection
The same model runs on every tissue. It reads the full panel rather than a few markers, so it is robust to dropout, low sensitivity, and segmentation errors.
See what MiraTyper finds in your data
Add your details, pick a time and we will run two datasets for free. Quick and easy.
- 1. Your details
- 2. Choose a time
Choose a time to get started
Your request is saved. If none of these times work, we can follow up by email.
Loading available times…
Calendar not loading? Open scheduling in a new tab.
Build a Biological Coordinate System
Cell types and states are the join key across every supported modality. When each platform is typed the same way, results from different instruments align instead of requiring reconciliation.
Measurement Layer
Integration happens where measurements are made, not after each platform has produced its own report, so biology and context survive the join.
One Ontology
The same 425-type Cell Ontology spans single-cell, spatial, protein, and H&E data, so an instrument change does not reset the analysis.
Re-queryable
Existing data answers new questions. Adding a platform or a primitive does not invalidate earlier measurements.
Agent-Ready
Skills and tools are deterministic and token-efficient, and plug into an existing agentic system or one MiraOmics builds.
Measured, Per Panel, in Public
Every supported panel is benchmarked separately, and the scoring rules are published with the numbers. Nothing here is averaged into a single headline figure.
0.894–0.909 Hierarchical F1
Across supported gene panels on a held-out test set of 110,952 cells and 425 classes. On real vendor-labeled tissue the figure is lower, and that number is published too.
0.965–0.996 AUROC
Earlier v1.3-era panel evaluations, using different test and validation sets. Released v1.9 models include colorectal training data; performance and thresholds should be validated for the intended tissue and assay.
Highest F1 at Every Stringency
Compared with four published annotation tools across seven datasets, six tissues, and about a million cells, at three levels of label-matching strictness.
Labels on a Tree, Not a Flat List
MiraTyper predicts into the Cell Ontology, so a near miss is scored as a near miss rather than a total error.
425 cell types arranged across the standardized Cell Ontology, plus a dedicated malignant-versus-normal classifier. Every label arrives pre-harmonized, so results merge cleanly across studies.
~250M Cells
Our source collection contains about 250 million cells. Training uses a carefully curated subset with harmonized Cell Ontology labels. Recreating this training resource requires the selection, curation, and label harmonization across source studies, as well as the data itself.
Ontology and Confidence
Pre-harmonized Cell Ontology labels, each with a confidence score.
No Reference Set
Nothing to curate or transfer from. Custom cell types can be fine-tuned in under an hour.
RNA, Protein, H&E
Transfer learning carries the same label space into protein panels and H&E.
Build Each Detector Once, Reuse It Everywhere
Primitives detect one thing reliably. Skills combine them into analyses. Both share one data structure, so they work together across instruments and modalities.
Primitives
Validated detectors, with typical build effort.
- Lymphocytes Available
- Malignant cells Available
- 425 normal cell types Available
- Cancer cells Available
- Cancer vs. normal Available
- H&E segmenter Available
- Normal cell detector Available
- PSMA expression Early
Skills
Analyses composed from primitives, light on compute and tokens.
- Triad detector Available
- TLS detector Available
- Niche detector Available
- Report generator Available
- Data manager Available
In Development
Planned primitives and the applications they open up.
- HER2 protein and RNA from H&E Planned
- MSI / MMR colorectal structure from H&E Planned
- Tumor-infiltrating lymphocytes from H&E Planned
- Tumor–stroma ratio from H&E Planned
- Hot vs. cold tumors from H&E Planned
- EGFR, KRAS, TP53 mutation status from H&E and RNA Planned
- HRD / BRCA-ness: ovarian, breast, prostate, pancreatic Planned
- CAF content, desmoplasia, macrophage polarization Planned
- Normal and cancer cells from protein Planned
- Mouse normal and cancer cells from RNA Planned
- Glioblastoma classifier for CosMx Planned
- MASH fibrosis and steatohepatitis scoring Planned
- IBD, kidney, and lung fibrosis activity Planned
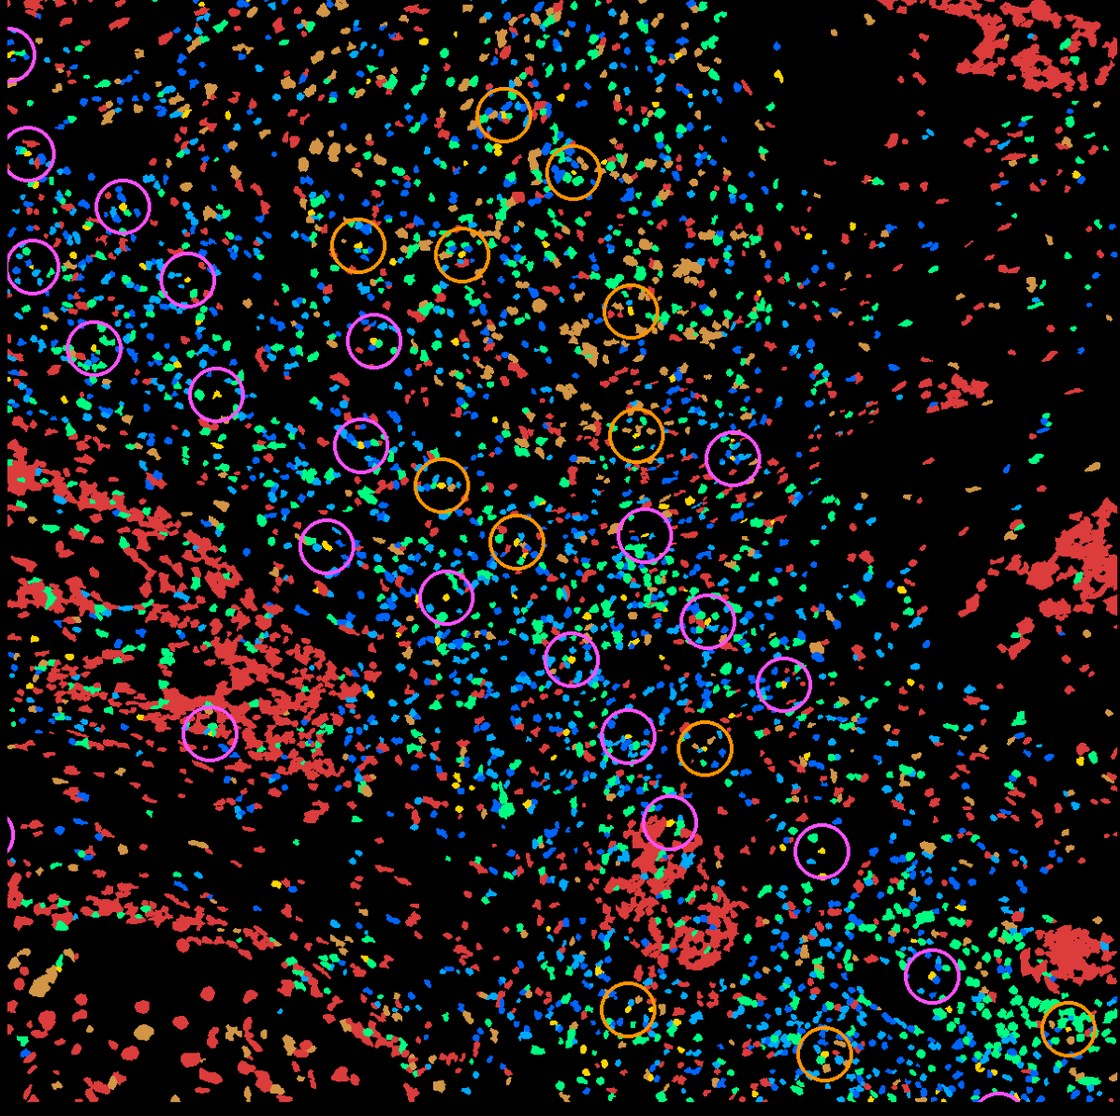
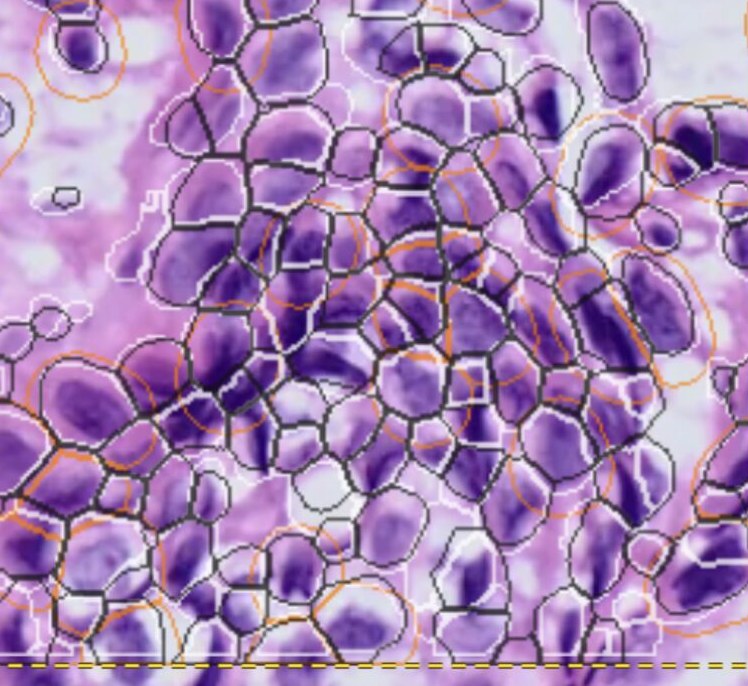
The Same Engine on Different Instruments
The label space stays fixed while the data source changes, which is what makes niche, ligand–receptor, and trajectory analyses comparable across studies.
Put MiraTyper on Your Own Data
Available as a Docker package for your own environment: CPU for transcriptomics, GPU for H&E, including on an air-gapped network.