
De-risk Clinical Trials Using H&E and Multi-omics Data
Match your therapy with the patients most likely to benefit. MiraTyper uses H&E and multi-omics data to help your team identify potential responders and non-responders as you build a cohort, with interpretable measurements and pathologists in the loop.
- Search active-patient databases for candidates who match your criteria
- Use consistent, repeatable criteria to screen trial patients
- Work with public data, your data, and third-party databases
 Kite / Gilead
 Elephas
 UC Riverside
 University of Kentucky
Plus many more
One Platform, Many Applications
The same measurements serve every stage of an asset's life, because features are measured rather than folded into a single prediction.
Screen Thousands of Candidates for a Match to Your Therapy
Screen thousands or millions of candidates using the standard-of-care H&E slides already collected. MiraTyper measures the features linked to response and ranks candidates against them, before enrollment closes.
See how it worksFind the Likely Responders Your Biomarkers Miss
Use tissue features as a lens: MiraTyper measures the biology that drives response, so patients outside the standard biomarker cut stop being invisible.
See how it worksFind Out Why the Trial Did What It Did
When outcomes are in, MiraTyper measures the tissue the trial already collected and correlates those measurements with response and toxicity — so the next design starts from evidence, not hypothesis.
See how it worksFind the Biology That Separates Your Groups
MiraTyper types every cell in a section the same way across platforms and species, so the differences between conditions show up as measurements instead of impressions.
See how it worksH&E Is Collected Everywhere and Measured Almost Nowhere
Standard-of-care histology records immune infiltration, vasculature, stroma, and tissue architecture, all linked to prognosis and drug response. Extracting that by hand is slow, and connecting it to RNA, DNA, and spatial data is harder still.
Heterogeneity Hides Efficacy
When a trial mixes likely responders with likely non-responders, a drug's true effect can disappear into the average, and biomarker hypotheses stay weak.
Pathologists Become Counters
Quantifying morphology across hundreds of slides is repetitive manual measurement, for pathology teams already stretched across H&E, IHC, and spatial data.
Archived Slides Sit Idle
Slides from past and ongoing trials already hold answers to new questions, but without systematic measurement they cannot be queried.
See what MiraTyper finds in your data
Add your details, pick a time and we will run two datasets for free. Quick and easy.
- 1. Your details
- 2. Choose a time
Choose a time to get started
Your request is saved. If none of these times work, we can follow up by email.
Loading available times…
Calendar not loading? Open scheduling in a new tab.
From Routine H&E to an Analysis-Ready Dataset
MiraTyper returns measurements, not a single prediction: a feature table, slide overlays, and scores for every patient and across the cohort. Cell type is the join key, so H&E, spatial, and single-cell data share one label space.
Slides and Data
Standard-of-care H&E, plus spatial, single-cell, or protein data where available.
- H&E whole-slide images
- Xenium, CosMx, Visium HD
- Single-cell RNA-seq
- Response, toxicity, outcomes
Validated Detectors
Each primitive detects one thing reliably, such as a cell type or a molecular signal, validated on orthogonal data.
- Malignant cells from H&E
- Lymphocytes from H&E
- 425 cell types from RNA
- Tissue segmentation
Composable Analyses
Skills combine primitives to answer a study question, so a new question rarely requires a new model.
- TLS detector
- Immune triad detector
- Niche detector
- Report generator
Actionable Measurements
Per-patient and cohort reports, ranked by the features that matter to the study.
- Feature table per patient
- Slide overlays
- Percentiles versus cohort
- Selection scores
Simple Histological Features Track Clinical Outcomes
Published studies link H&E features to MSI status, prognosis, and response to checkpoint, VEGF, and chemotherapy regimens. MiraOmics turns the features relevant to each program into primitives.
| Feature | Appearance on H&E | Relevant to |
|---|---|---|
| Tertiary lymphoid structures | Organized lymphocyte clusters in or around the tumor | MSI/MSSPrognosisCheckpoint |
| Tumor-infiltrating lymphocytes | Lymphocyte density, and position relative to tumor and stroma | MSI/MSSCheckpointPrognosis |
| Plasma cells | Aggregates of plasma cells | MSI/MSSCheckpoint |
| Dirty necrosis | Neutrophil pockets and debris within necrotic tumor | MSI/MSSPrognosisKRAS status |
| Fibrosis | Dense stroma of elongated fibroblasts | MSI/MSSPrognosisVEGFCheckpoint |
| Vasculature | Tumor-associated blood vessels | VEGF responseCheckpoint |
| Aneuploidy | Abnormal chromosome content in tumor cells | MSI/MSSPrognosisCheckpoint |
Associations come from the published literature and vary in direction and strength by indication. Each feature is validated for a program before it is relied on.
What MiraTyper Reads from H&E Today
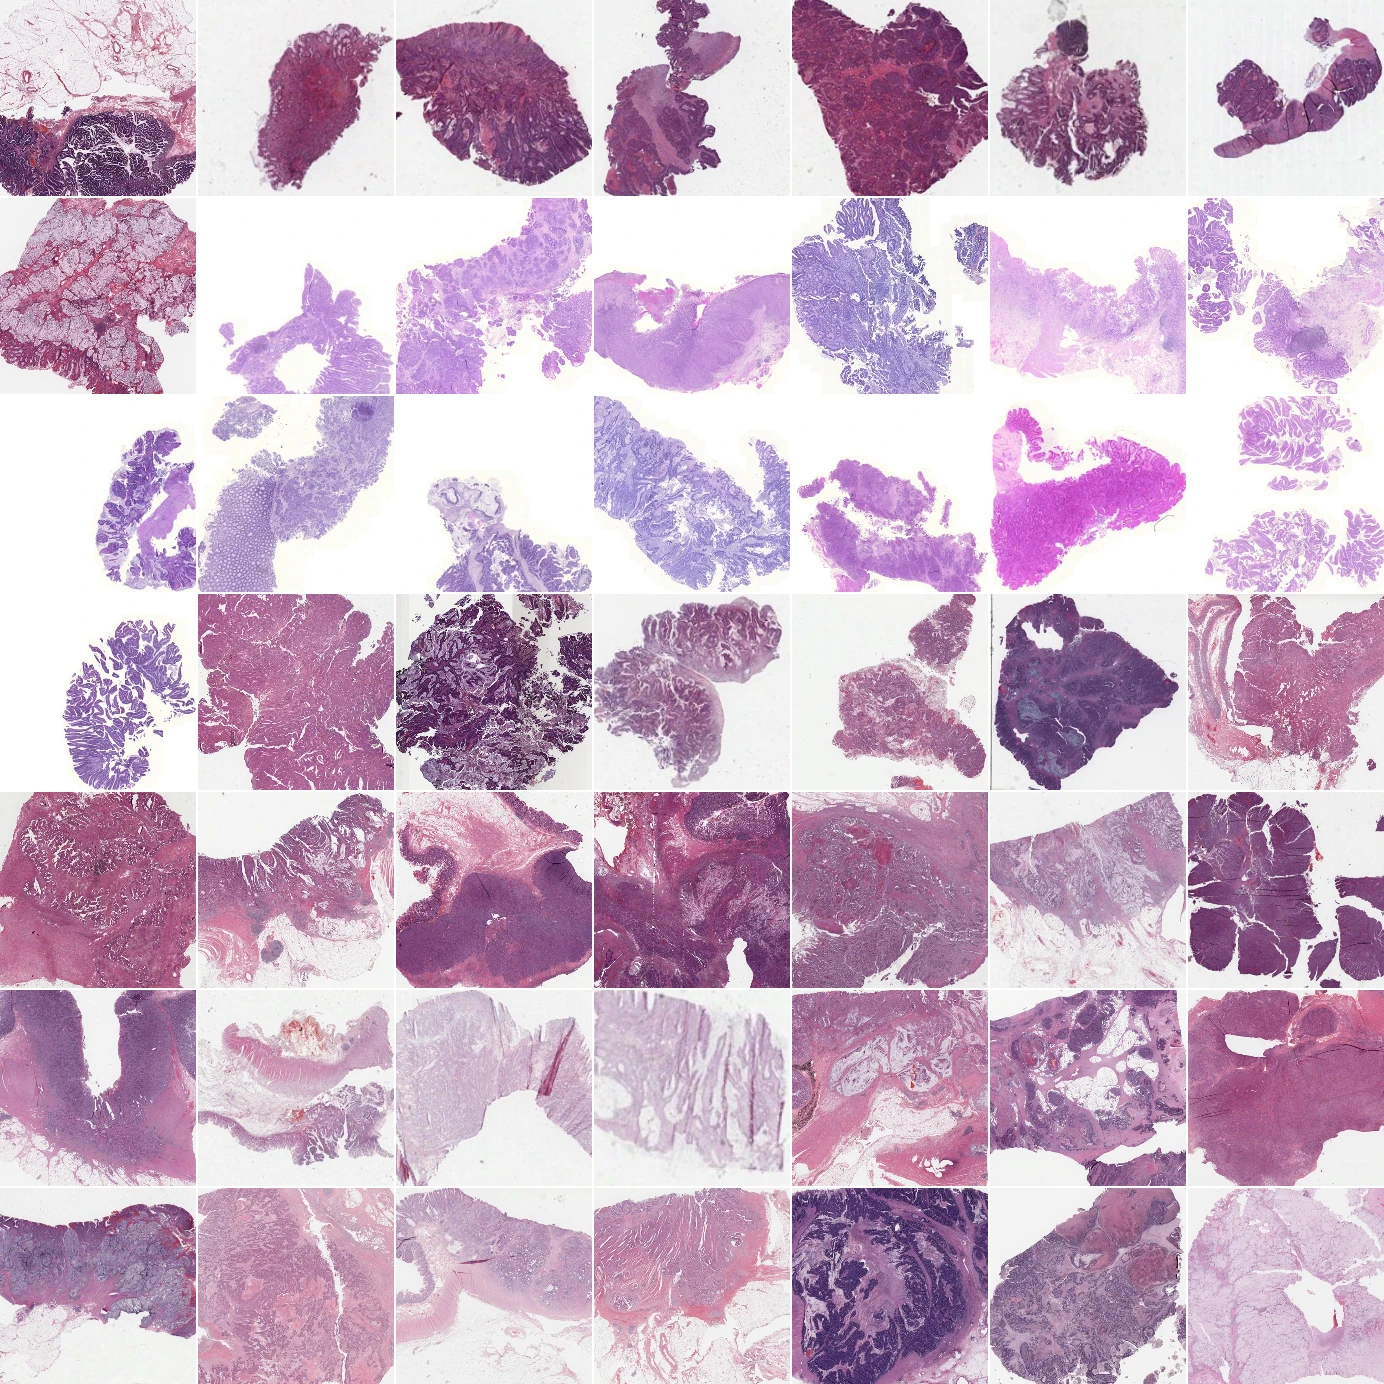
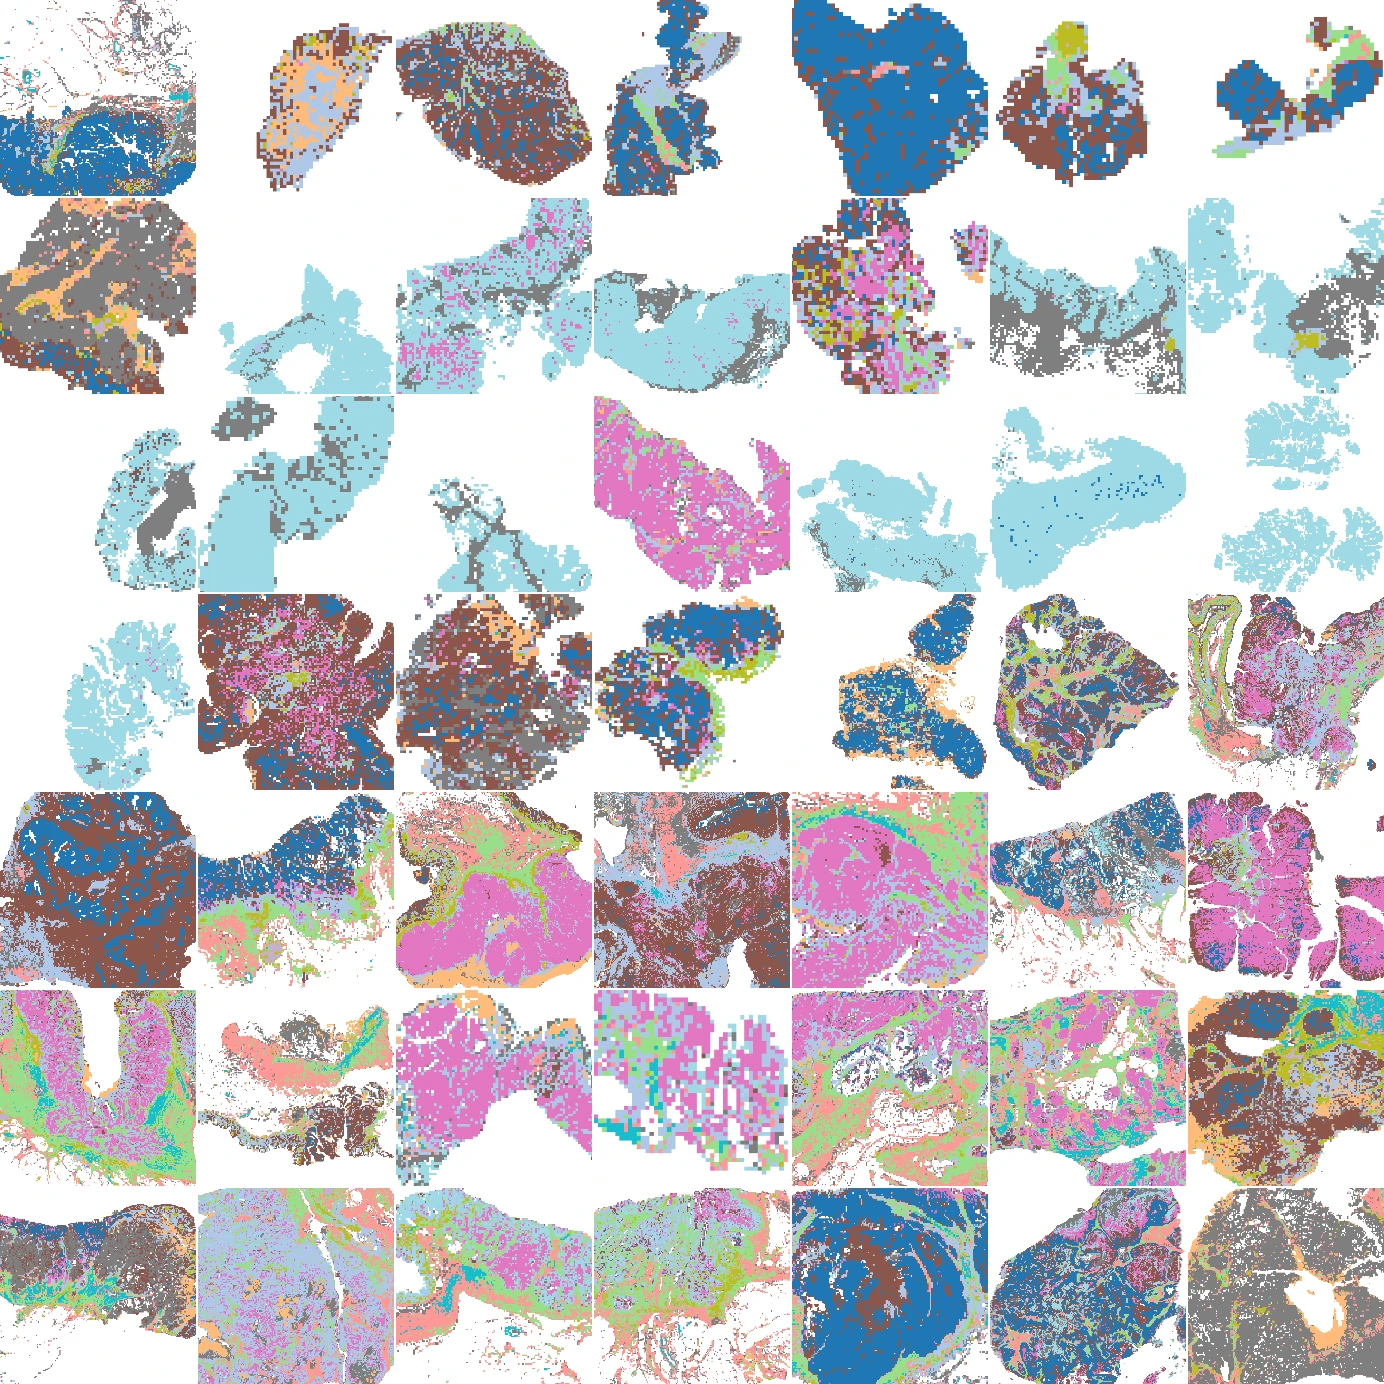
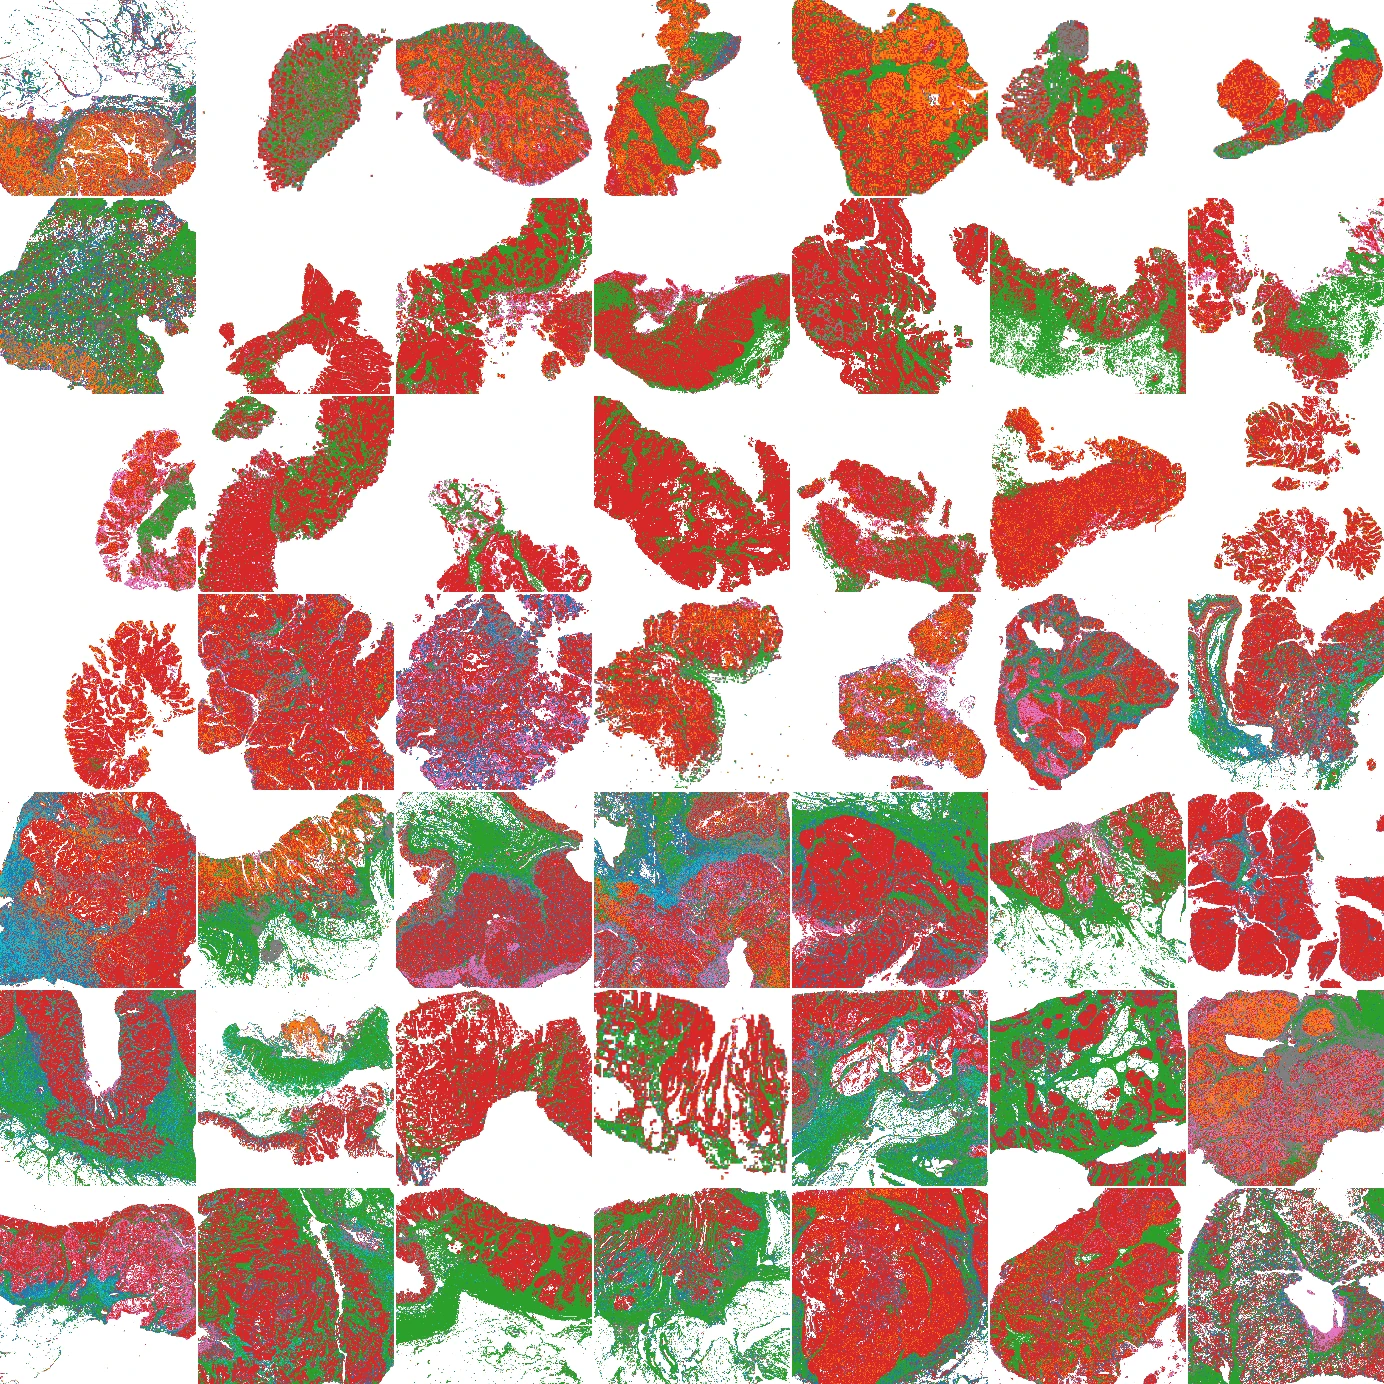
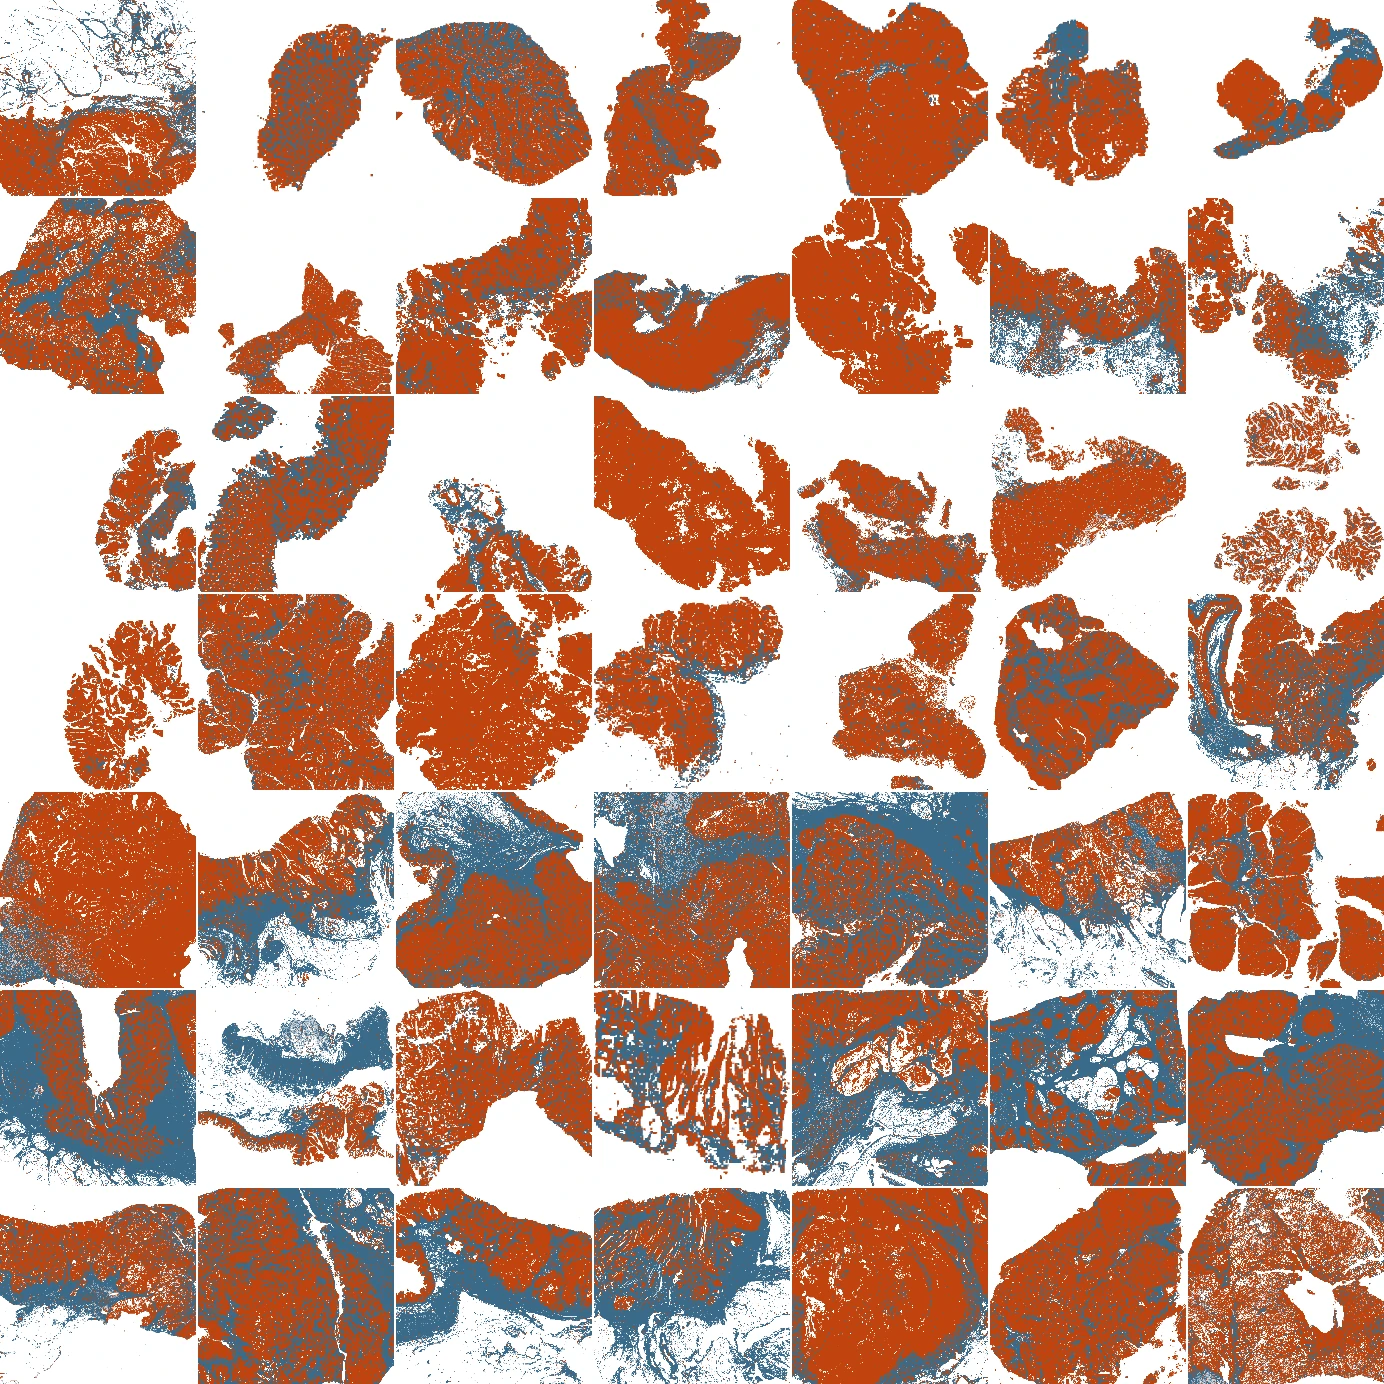
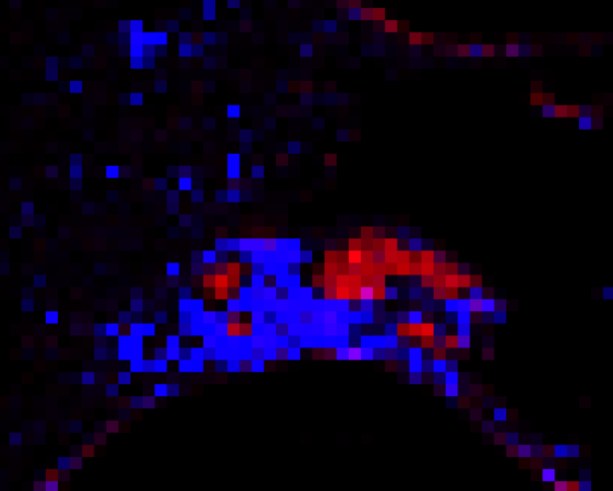
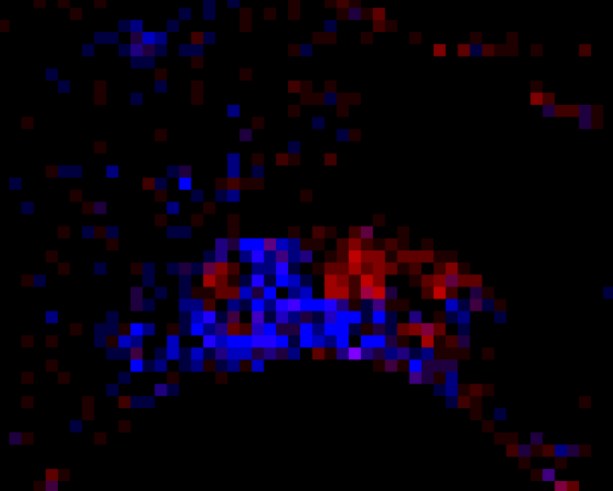
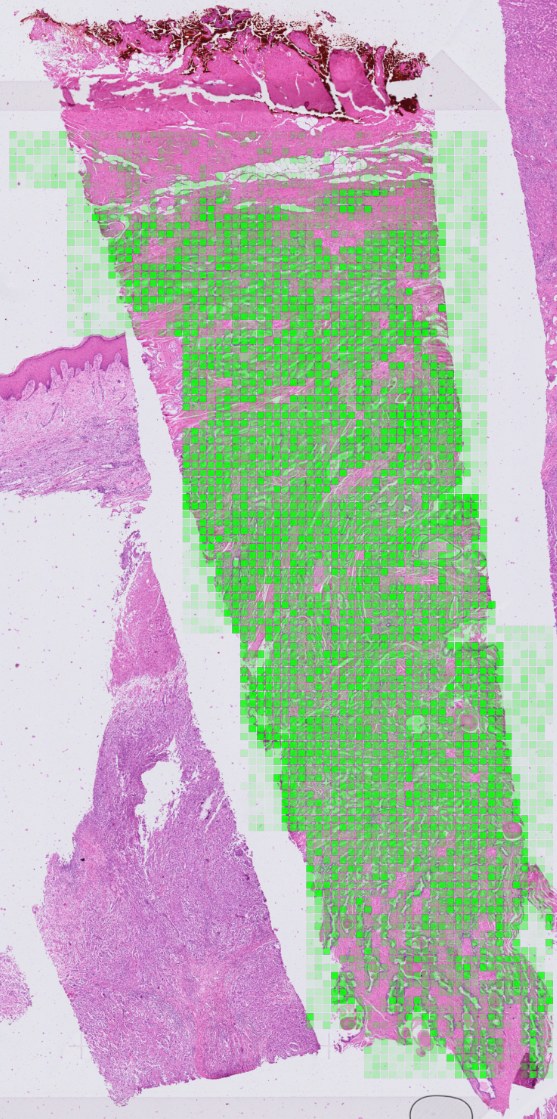
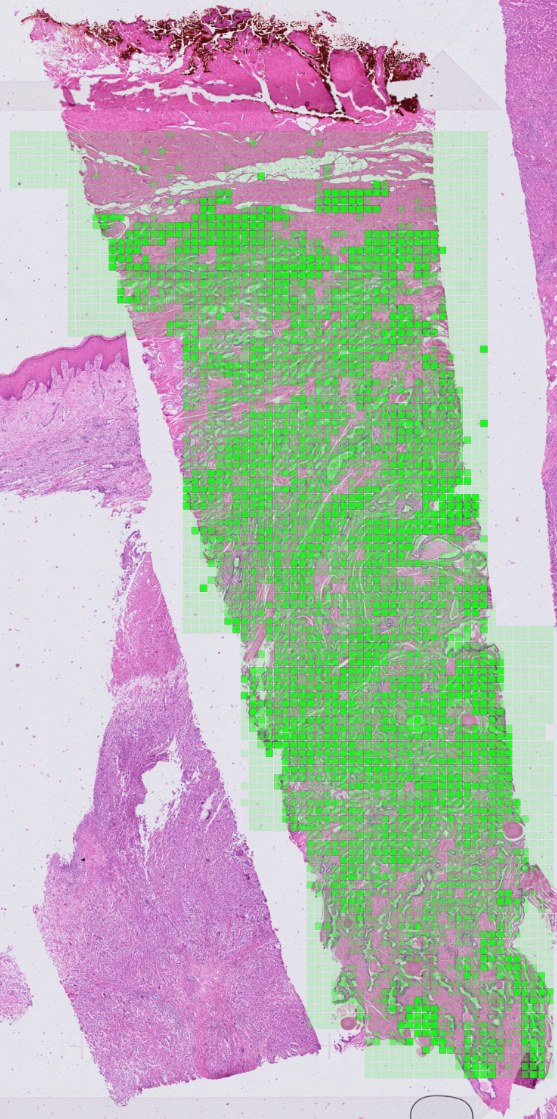
Examples from MiraOmics studies. Each H&E prediction is shown beside its reference.
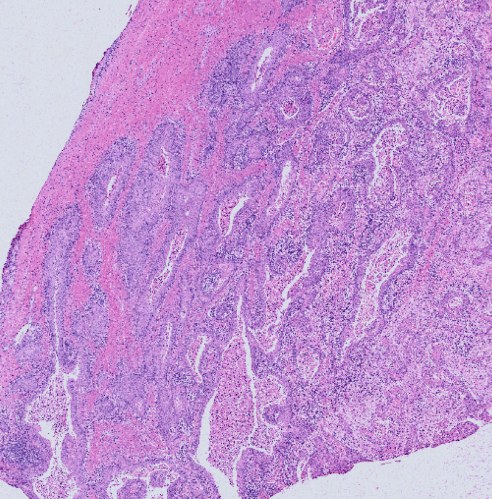 H&E input
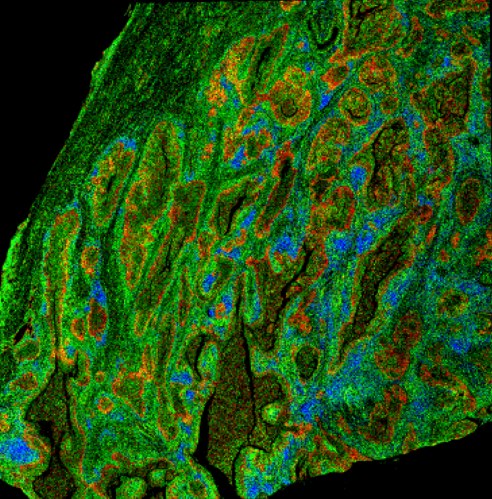 Reference
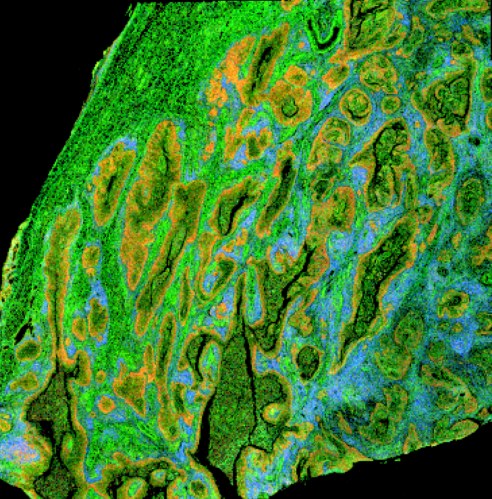 Predicted from H&E
- Malignant
- Immune
- Other
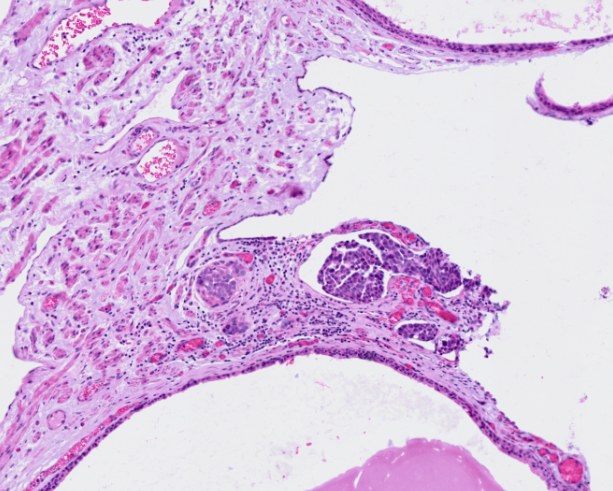 H&E input
 Predicted
 Ground truth
 Predicted from H&E
 Measured by Xenium
Why a Feature-Based Approach
If you train to predict outcomes directly, you need slide collections linked to those outcomes, and their predictions can be hard to interpret. MiraTyper measures defined tissue features that your team can inspect, compare, and combine for the decision at hand.
| Property | Manual Feature Selection | Foundation Model | MiraTyper |
|---|---|---|---|
| Data source | Manually annotated images | Whole-slide images with metadata | Literature and public data |
| Interpretability | High | Low | High |
| Effort and cost | Very high | Moderate to high | Low |
| Throughput | Low | High | High |
| Configurable across drug classes | Yes | No | Yes |
| Combinations (drug X and/or Y) | Limited | Limited | Yes |
| Portability across diseases | High | Moderate | High |
| Spatial, IHC, and other modalities | No | No | Yes |
The Process, Not Just the Product
A pilot runs for three months against one asset and one decision. What it delivers, when, and who owns the result afterwards are written down before any analysis starts.
Acceptance Criteria Agreed Up Front
The question, the cohort, the features, and the success metrics are fixed in the scope before work begins — so there is a defined test the work either passes or fails, not a subjective review at the end.
Documentation as a Deliverable
Methods, model versions, parameters, and QC are written down as the work proceeds. Every measurement traces back to the region of the slide it came from, so results survive an audit and a change of staff.
Milestone Reviews with Your Pathologists
Findings are reviewed at each milestone with the people who will have to defend them internally. Feature definitions get refined with the pathology team rather than handed to them finished.
Handover, Not Lock-In
The container, the model versions, and the configuration run in your environment. Your team can rerun everything after the pilot ends, and the primitives built for you stay available across platforms.
Before You Run Your Datasets
Do our slides or clinical data have to leave our network?
No. MiraTyper ships as a Docker package and runs inside your environment — a laptop, your cloud, or an air-gapped network. Transcriptomics inference runs on CPU with no GPU required.
How do we know the measurements are valid?
Every supported panel is benchmarked and published on the technical page, and the model has been evaluated against four published annotation tools across seven independent datasets. H&E feature detectors are validated against matched molecular data before they are used on a program.
What if the feature our program cares about has no detector?
Most new primitives take about a week to build, and are validated on orthogonal data before use. The feature set is agreed at the start of a pilot so the build happens before any scoring.
Will this replace our pathologists?
No. MiraTyper performs the exhaustive measurement; pathologists decide which features matter, review the overlays, and own diagnosis, QC, adjudication, and interpretation. Every number traces back to a region of the slide.
How reproducible is it?
The model is deterministic and is not LLM-based: the same slide yields the same measurements on every run. No tokens, no sampling, no run-to-run variance.
What does a first engagement cost?
Pilots are scoped per program — one asset, one decision, three months, with success metrics agreed up front. Bring the asset to the call and you will get a number and a timeline.
Run two datasets for free
Bring one asset and one decision. We will tell you on the call whether the tissue can answer it.
P.S. The slides are already cut, already archived, and already paid for. The only question is whether anyone measures what is on them.