
Everything Needed to Evaluate MiraTyper
Benchmarks per panel, an independent comparison against four published tools, the deployment model, and the limitations. No login required to read any of it.
- Deterministic inference: same input and version, same output
- Runs inside your environment: CPU for transcriptomics, GPU for H&E
- Predictions constrained to a standard ontology, with confidence scores
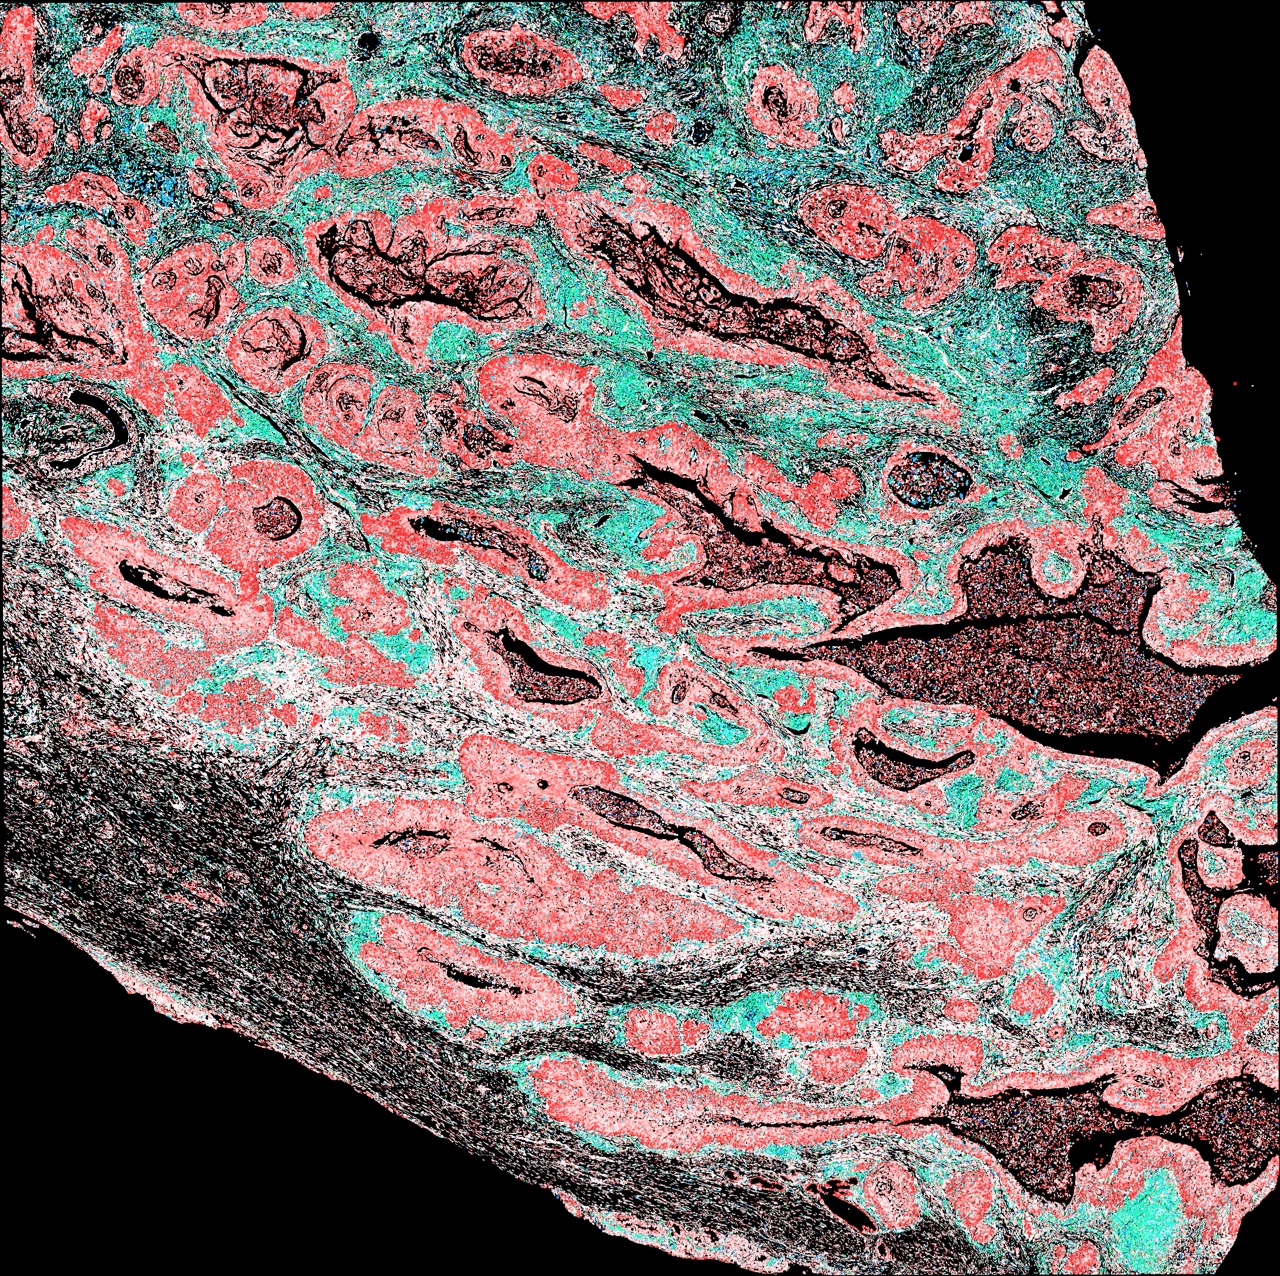
What Goes In, What Comes Back
One model covers every supported modality, and results land in the same label space regardless of which instrument produced the data.
| Modality | Input | Output |
|---|---|---|
| H&E whole-slide images | Standard whole-slide formats | Per-tile composition and feature measurements at 2.4 µm; slide overlays |
| Single-cell RNA-seq | AnnData (.h5ad) | Cell type, confidence score, and malignancy probability per cell |
| Probe-based spatial | Xenium, CosMx, Atera, Singular exports | Typed cells in place, plus niches and structures via skills |
| Sequencing-based spatial | Visium, Visium HD | De-noised bins, segmented cells, then typed cells |
| Protein + RNA panels | Singular, Xenium | Typed cells with marker-level QC against the call |
Results are written as AnnData or parquet, alongside the overlays and per-patient reports the skills produce.
Every Gene in the Panel, for Every Cell
MiraTyper uses the expression profile across all genes in the measured panel to classify each cell. The call draws on the combined pattern, giving each gene context within the rest of the cell’s expression profile.
Use the Whole Panel
Every cell is represented using all genes in the panel. Signals from many genes contribute to the cell-type call, so the analysis uses more of the data your assay already measures.
Deterministic and Small
A trained classifier maps embeddings to cell types. It is not generative: no prompts, no sampling, no tokens at inference.
Ontology-Constrained
Predictions are constrained to the Cell Ontology, so uncertainty resolves upward to a coarser ancestor instead of a confidently wrong leaf.
Scored Separately
A dedicated classifier assigns each non-immune cell a malignancy probability between 0 and 1, reported alongside its type.
Benchmarked on Every Supported Panel
Hierarchical F1 gives partial credit for typing a cell to the correct lineage. Malignancy is scored separately, as a per-cell probability.
| Panel | Genes | Onboarding | Hierarchical F1 | Malignancy AUROC | Malignancy F1 |
|---|---|---|---|---|---|
| Full transcriptome | ~33K | N/A | 0.901 | 0.984 | 0.874 |
| Atera Xenium WTARuns the full-transcriptome model; its metrics shown | ~18K | <1 day | 0.901 | 0.984 | 0.874 |
| CosMx 1K | 1,000 | <1 day | 0.909 | 0.988 | 0.900 |
| CosMx 6K | 6,000 | <1 day | 0.896 | 0.983 | 0.883 |
| Xenium 5K | 5,090 | <1 day | 0.904 | 0.965 | 0.865 |
| Xenium 500 | 480 | <1 day | 0.894 | 0.982 | 0.874 |
| Xenium Immuno-Oncology 380 | 367 | ~1 day | — | 0.995 | 0.899 |
| Singular G4XLung panel; malignancy re-scored after a label-decoding fix | 294 | ~3 days | — | 0.996 | 0.942 |
— Hierarchical F1 is not computed for the two protein-panel models; only malignancy is scored on those.
Platforms
10x Chromium 5′ and 3′; probe-based Xenium, CosMx, Atera, Singular; sequencing-based Visium and Visium HD.
Resolution and Throughput
Single-cell resolution for transcriptomics; H&E scanned at 0.27 µm per pixel and measured in 24 µm tiles. Transcriptomics runs at roughly 300–480 cells per second on a laptop CPU; a 97,000-tile H&E slide takes about 3.8 minutes on a single GPU instance.
Onboarding
Gene panels onboard in under a day. A new instrument needing a full retrain has taken about three days; the smallest panel benchmarked so far is 294 genes.
Measured Against Four Published Tools
Seven independent datasets, six tissues, and about one million cells, scored as micro F1 against two reference systems at three levels of stringency.
Author Reference
Labels as published by each dataset’s authors
Exact reference identity
Strict resolution-preserving
Marker-adjudicated
CELLxGENE Reference
Labels harmonized to the CELLxGENE ontology
Exact reference identity
Strict resolution-preserving
Marker-adjudicated
Micro F1 (%) with exact-label scoring against third-party annotations, a harsher measure than the hierarchical F1 in Table 2, which gives partial credit for the correct lineage. Marker adjudication resolves naming synonyms and credits correct finer subtypes, and raises every tool's score.
Where MiraTyper and the Authors Disagree
Immune and stromal cells, n = 17,699 · Durante et al. 2020, Nature Communications
- Agree with author 76.6%
- MiraTyper likely correct 12.6%
- Ambiguous 3.5%
- Author likely correct ~1%
- Not adjudicated 6.4%
Disagreements were adjudicated against canonical marker expression. Where the markers settle the question they side with MiraTyper far more often than with the original annotation — which is the argument for treating published labels as a reference rather than ground truth.
What Each Number Means
Cell-typing scores are easy to inflate by choosing a lenient matching rule, so the rule is stated with every number above.
Hierarchical F1
Cell types closer to the ground truth in the ontology receive higher scores than those farther away. Used for per-panel benchmarks.
Micro F1, Exact Label
Strict string-level agreement with the reference label. Lower for every tool, and the fairest way to compare tools that use different label vocabularies.
Malignancy AUROC and F1
Per-cell malignant-versus-normal scores against annotated ground truth, reported separately from cell-type accuracy because the two fail in different ways.
Runs Where the Data Already Lives
Docker, in Your Environment
A container reads from your storage and writes results back to it. Laptop, on-premise server, or your own cloud account — no MiraOmics-hosted service in the path.
Air-Gapped Capable
No outbound calls are required at inference, so the container runs on a disconnected network. Nothing phones home.
Hardware by Workflow
Transcriptomics inference runs on CPU, including on a ten-core laptop. H&E models require a GPU, including the image-based segmentation used for Visium HD.
Versioned and Reproducible
Model versions are pinned and tracked with their benchmarks, so a result from a year ago can be regenerated exactly.
What It Does Not Do
The failure modes matter more than the headline numbers when a result feeds a program decision.
Research Use Only
MiraTyper is intended for research, including clinical trial design, biomarker exploration, and cohort definition. It is not intended for patient diagnosis outside research. Use in clinical studies requires appropriate validation and oversight.
Performance Depends on the Dataset
The 0.894–0.909 hierarchical F1 scores come from a held-out CELLxGENE benchmark evaluated with different gene panels. A separate evaluation on a real Xenium 5K lymph node scored 0.81 after reference-label corrections. These tests use different samples and reference labels, so their scores answer different questions. Both are reported separately; performance on a new study needs its own evaluation.
Some Capabilities Are Early
Expression prediction from H&E, such as PSMA, is an early result under evaluation against IHC on serial sections. The mouse model is a prototype. These are labeled as such wherever they appear.
Garbage In Still Applies
Segmentation error, low-sensitivity panels, and poor tissue quality all degrade results. Confidence scores flag affected cells, but they do not repair the input.
Malignancy Is Tissue-Dependent
Malignancy performance varies by tissue, gene panel and assay. Normal epithelial and reactive immune cells can receive high malignancy scores, and the default threshold is not a universal operating point. Sensitivity, false-positive rates and thresholds should be evaluated on representative data for the intended tissue and platform.
Technical FAQ
Is MiraTyper an LLM?
No. Gene-level language-model embeddings are computed once, offline, and cached; inference itself is a deterministic classifier over those embeddings. There is no prompt, no sampling temperature, and no token cost at inference. The agentic tooling that sits around the model is optional and separate from the measurement path.
How do you handle a cell the model has not seen?
Each prediction uses the model’s current set of Cell Ontology labels and includes a confidence score. Low-confidence cells can be reviewed at a broader lineage level. Additional cell types can be added to the ontology and learned through fine-tuning on appropriate examples; the updated label set and model are versioned together.
What happens to our data?
Nothing leaves your environment. The model ships as a Docker image, reads from your storage, and writes h5ad or parquet back to it. It can run fully air-gapped; no telemetry or licence check phones home.
Can we reproduce a result from six months ago?
Yes, if you pin the model version. Inference is deterministic, so the same inputs and the same model version reproduce the same outputs exactly. Model versions and their benchmarks are tracked.
How is a new instrument onboarded?
The panel is characterized, then a model is trained and benchmarked against held-out data. Most panels take under a day; the smallest benchmarked panel so far is 278 genes, which took about three days including analysis.
Can we fine-tune on our own cell types?
Yes. Fine-tuning on custom types takes under an hour, and the resulting model stays deterministic and versioned like any other.
Run two datasets for free
Bring a dataset and the decision it needs to support. Technical questions get technical answers.
P.S. Bring the benchmark and acceptance criteria your team uses. We can agree on the evaluation before a pilot begins, so you know what evidence you will receive and how to judge it.