
Linking H&E Tissue Patterns to Microsatellite Instability in Colon Cancer
Cell composition and spatial organization inferred from routine histology carried a measurable association with molecular MSI status in an exploratory TCGA cohort.
1. Relating routine histology to a molecular phenotype
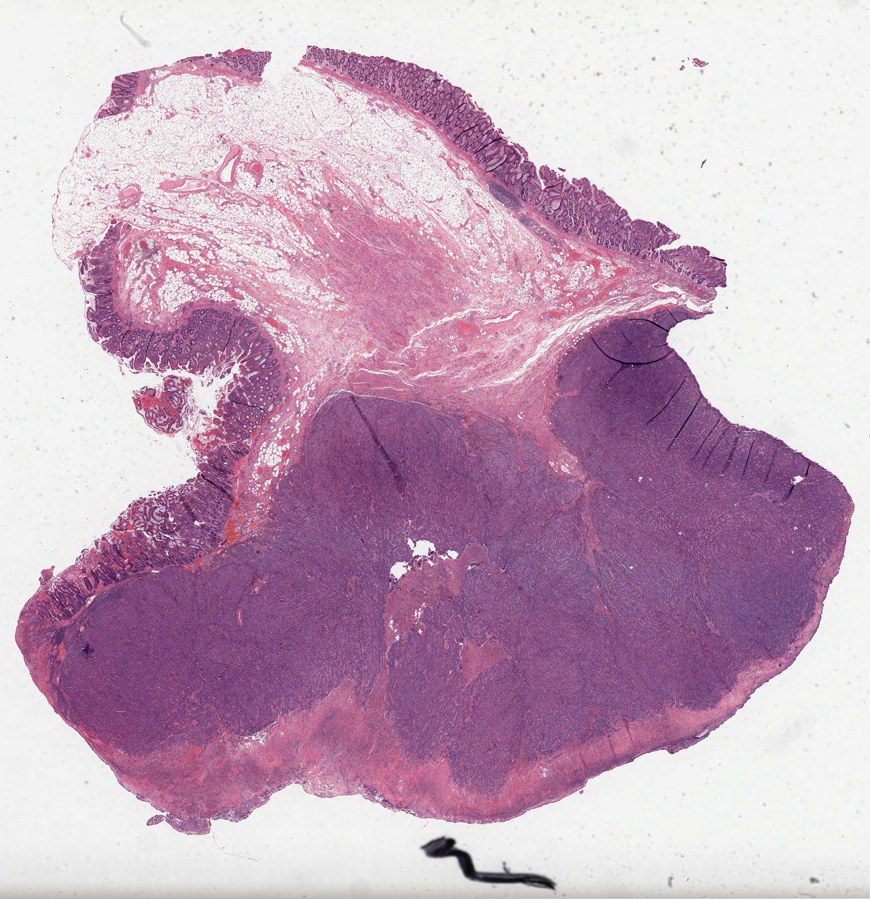
To determine whether routine tissue images retain information about molecular tumor state, we analyzed hematoxylin and eosin (H&E) slides from The Cancer Genome Atlas colon adenocarcinoma cohort (TCGA-COAD). We focused on microsatellite instability (MSI), a molecular phenotype associated with impaired DNA mismatch repair (NCI definition). The question was whether inferred cell composition and its spatial arrangement could distinguish tumors with high instability from microsatellite-stable tumors.
We compared H&E-derived features with molecular scores from MANTIS, a sequencing-based MSI assessment method (Kautto et al., 2017), with MSIsensor scores available as a secondary reference. Molecular measurements supplied the training and evaluation targets; inference used the slide image alone. The main prediction comparisons included 121–128 slides according to feature and reference-score availability. The binary comparison used MANTIS scores above 0.6 and below 0.4, excluding intermediate scores.
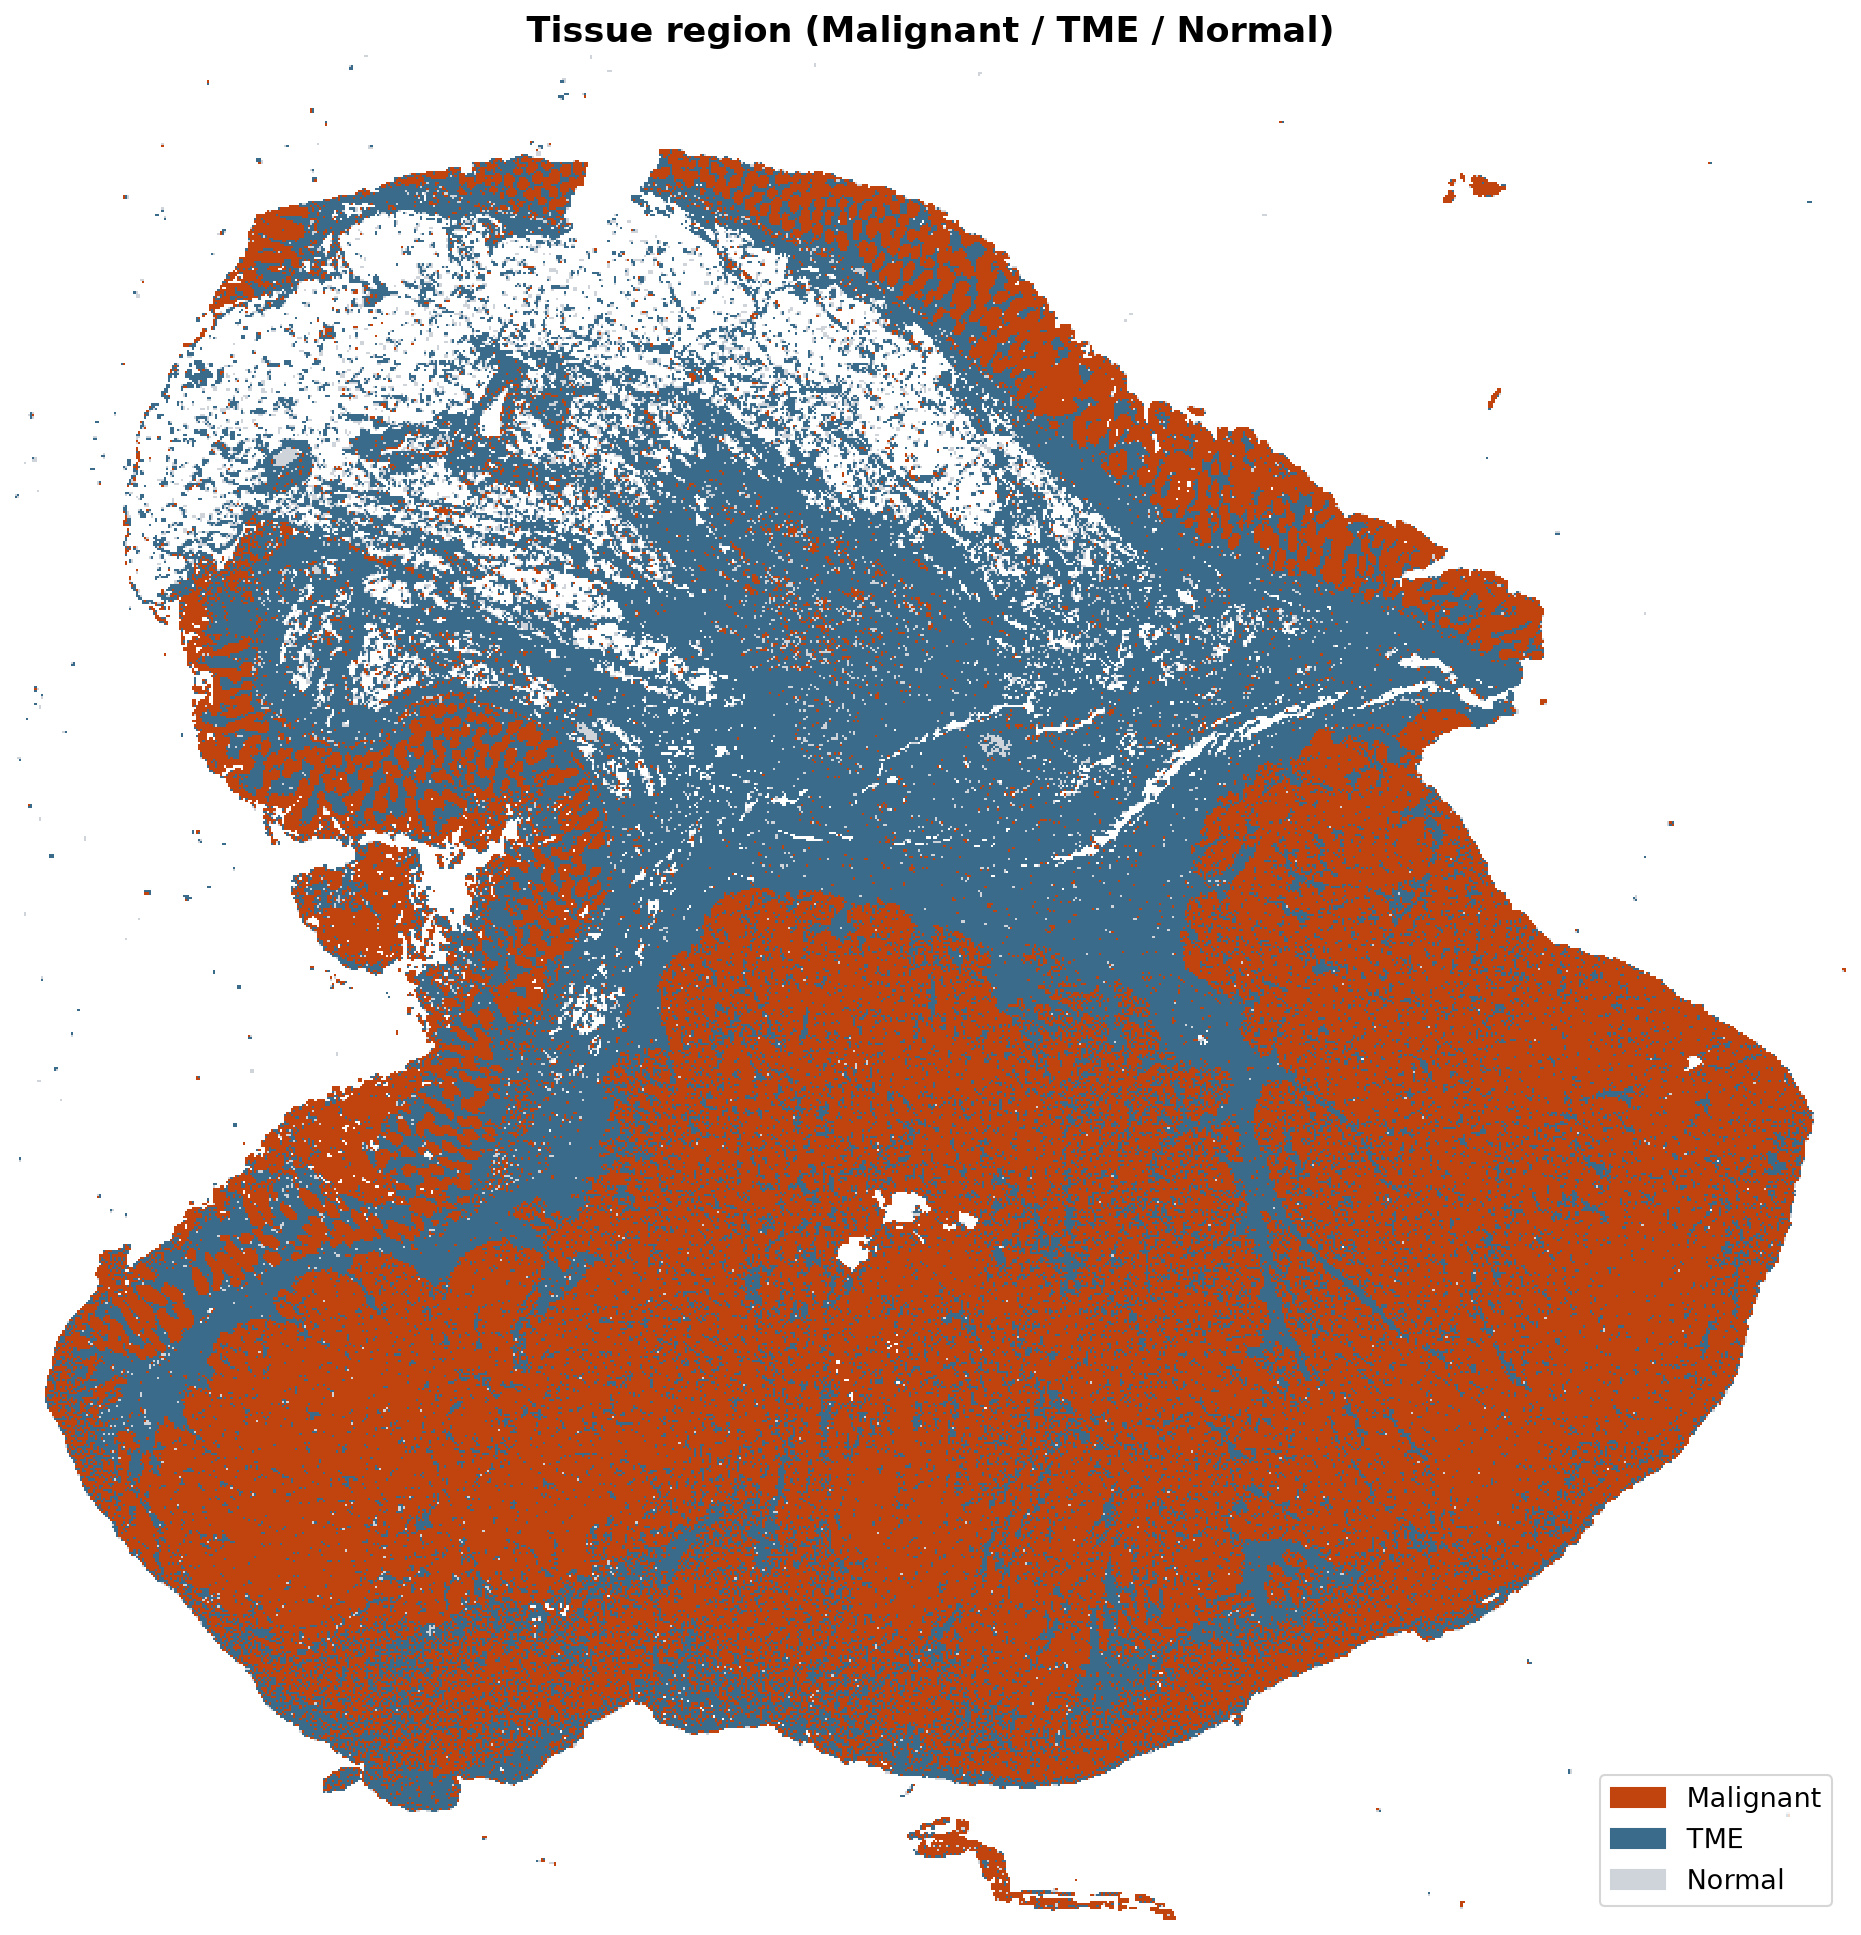
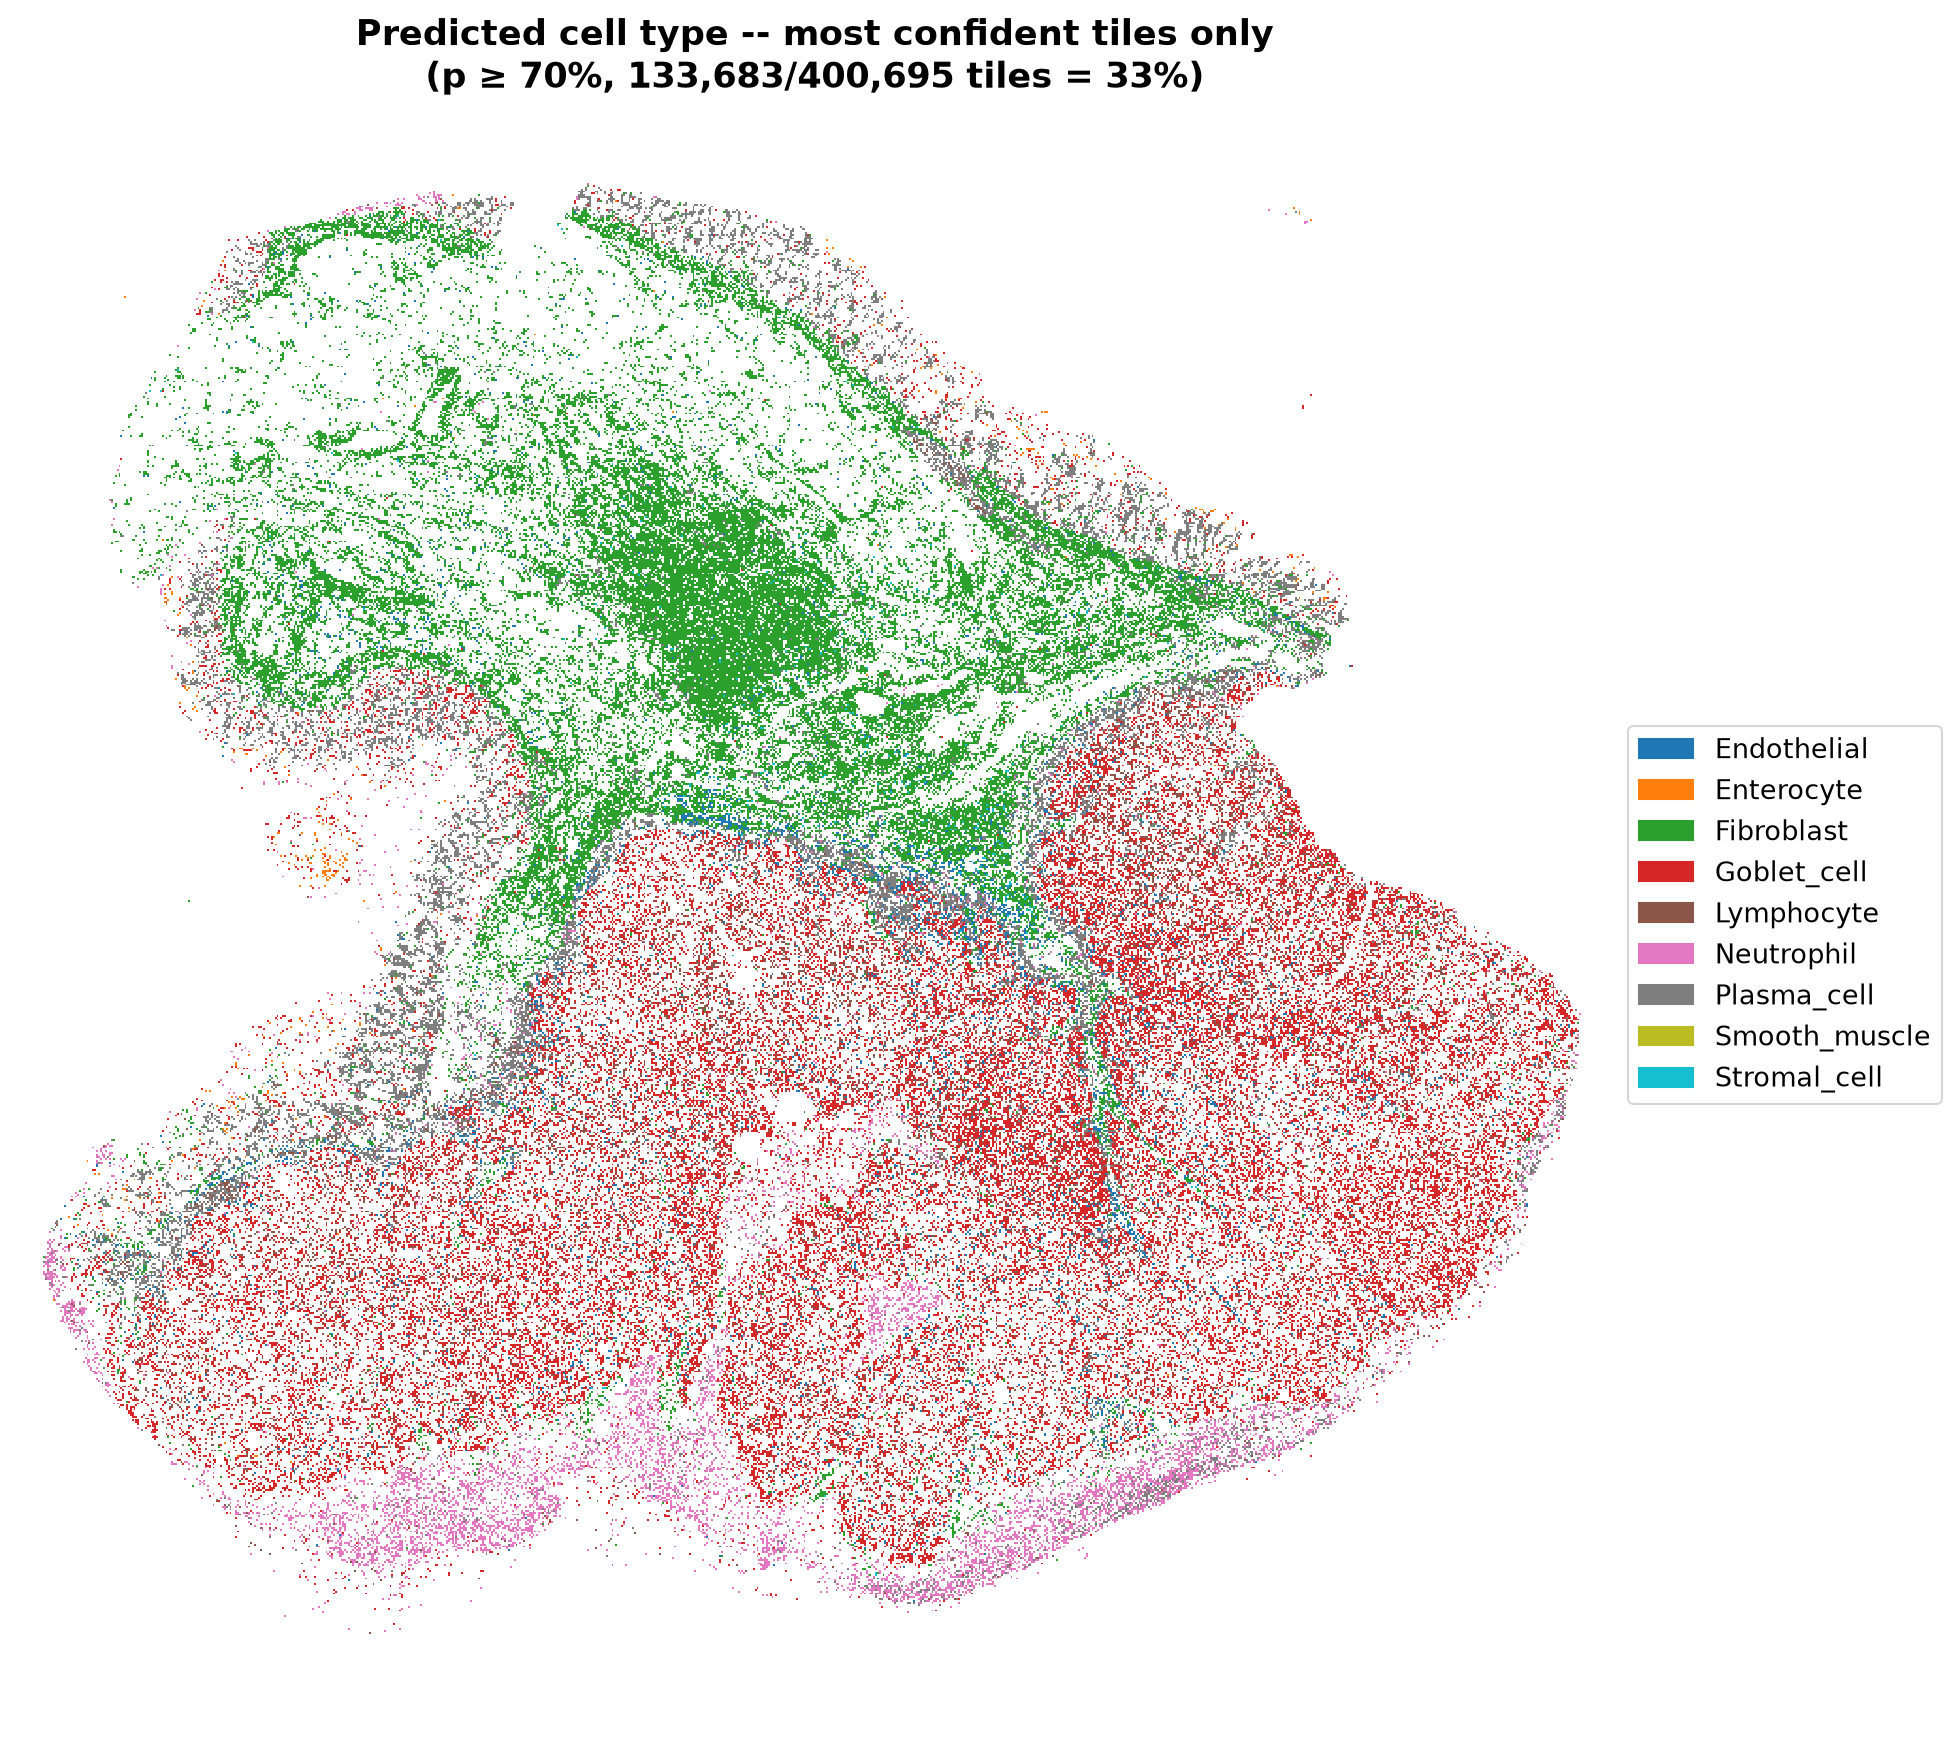
The image workflow summarized 24 µm tissue tiles into ten cell-identity classes and three tissue-region categories: malignant, tumor microenvironment, and normal. The tumor microenvironment includes the surrounding immune and supporting tissue. Larger neighborhoods, approximately 96 and 288 µm across, captured local composition and the tendency of predicted cell populations to occur together. These outputs are model-derived tissue measurements, rather than direct counts of individually segmented cells.
2. Spatial features retained information about MSI
To test whether location adds information beyond overall composition, we compared slide-wide averages with features describing local abundance, heterogeneity, and co-occurrence. If spatial organization contributes to the molecular association, these neighborhood features should improve discrimination over a composition-only summary. In repeated nested cross-validation, the combined spatial model achieved an area under the receiver operating characteristic curve (AUC) of 0.760, compared with 0.672 for the whole-slide composition model, consistent with additional information in tissue organization.
AUC measures how well a model ranks the two groups: 0.5 is chance-level ranking and 1.0 is perfect separation. It does not specify the proportion of patients correctly classified at a clinical threshold. Shuffling the molecular labels and repeating the modeling procedure reduced the spatial model's AUC to 0.506, supporting an association beyond that control.
| Image representation | AUC | Shuffled-label AUC |
|---|---|---|
| Whole-slide cell composition | 0.672 | 0.479 |
| Cell composition plus spatial relationships | 0.760 | 0.506 |
| Whole-slide image features | 0.779 | 0.510 |
The combined spatial model also tracked the continuous molecular score, with a Spearman rank correlation of 0.452, indicating a moderate association across the score range. A separate model using numerical image features without explicit cell-type labels achieved an AUC of 0.779, suggesting that morphology contains additional information that is not fully summarized by the modeled cell categories. Its image features, however, did not directly identify the biology responsible for that association.
3. Local patterns suggested a neutrophil-associated signal
To identify a biological interpretation for the spatial association, we examined where predicted populations were abundant together. Neutrophils, an innate immune-cell population, repeatedly appeared in MSI-associated features. The fraction of 96 µm neighborhoods with both high inferred neutrophil and malignant-cell content correlated with the molecular MSI score (Spearman correlation 0.316), suggesting that local tumor–immune composition contributed to the signal.
In a separate comparison of eight morphology-derived candidate features across 120 slides, the neutrophil feature was the only one retained after correction for multiple testing (adjusted p = 0.0041). The other seven candidates, including lymphoid aggregation, fibrosis, and lymphocyte abundance, did not meet that criterion. This concentrated the biological follow-up on a specific predicted population, while leaving the broader molecular association dependent on multiple features.
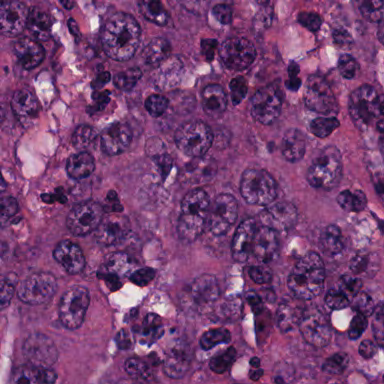
The repeated associations share the same underlying cell-inference pipeline and therefore do not constitute independent biological replication. An additional comparison with cell fractions estimated from bulk RNA sequencing did not positively confirm the H&E-derived neutrophil or plasma-cell abundance estimates. Together with the moderate performance of the underlying neutrophil model, this supports treating the cell-specific interpretation as a hypothesis requiring pathology or molecular validation.
4. Implications for tissue-based cohort review
We next asked whether concentrating on particular tissue appearances could preserve information diluted by whole-slide averaging. Models restricted to two selected morphology groups achieved a combined AUC of 0.834, but covered only 84 of 127 slides (66%). Expanding to five groups increased coverage to 116 slides (91%) while reducing AUC to 0.748, illustrating a tradeoff between discrimination and the fraction of specimens that can be scored.
Those groups were selected after screening 40 candidates in the same cohort. Their estimates therefore include selection optimism, even though model fitting was repeated within cross-validation. The two-group result should not be interpreted as an established improvement over the whole-slide models or as evidence that the approach will achieve that performance on an independent cohort.
For translational research, the practical output is a spatially inspectable description of each specimen: inferred tissue regions, local cell composition, and measurements positioned within a cohort distribution. These outputs could help investigators specify tissue features for a retrospective study and identify regions for orthogonal testing. These analyses did not assess treatment response or immunotherapy outcomes, so they do not establish whether an H&E score can select patients who will benefit from a therapy.
Scope of the evidence. The results support an exploratory association between H&E-derived tissue patterns and molecular MSI status. Independent patient cohorts, pathology review, calibration, and a prespecified evaluation are needed before diagnostic or treatment-selection use.
Study basis: MiraOmics TCGA-COAD classifier-comparison, tissue-composition, morphology-group, and individual-slide reports, September 27–29, 2026. Numerical results are reported from those analyses; no models were retrained for this case study.
Evaluate H&E on Your Research Cohort
Define the tissue features and validation criteria for a focused retrospective study.